How do I track my classes’ progress?
Last updated: October 15, 2026
📊 Track your classes’ progress across assessments
🧭 Where do I find my groups’ analysis?
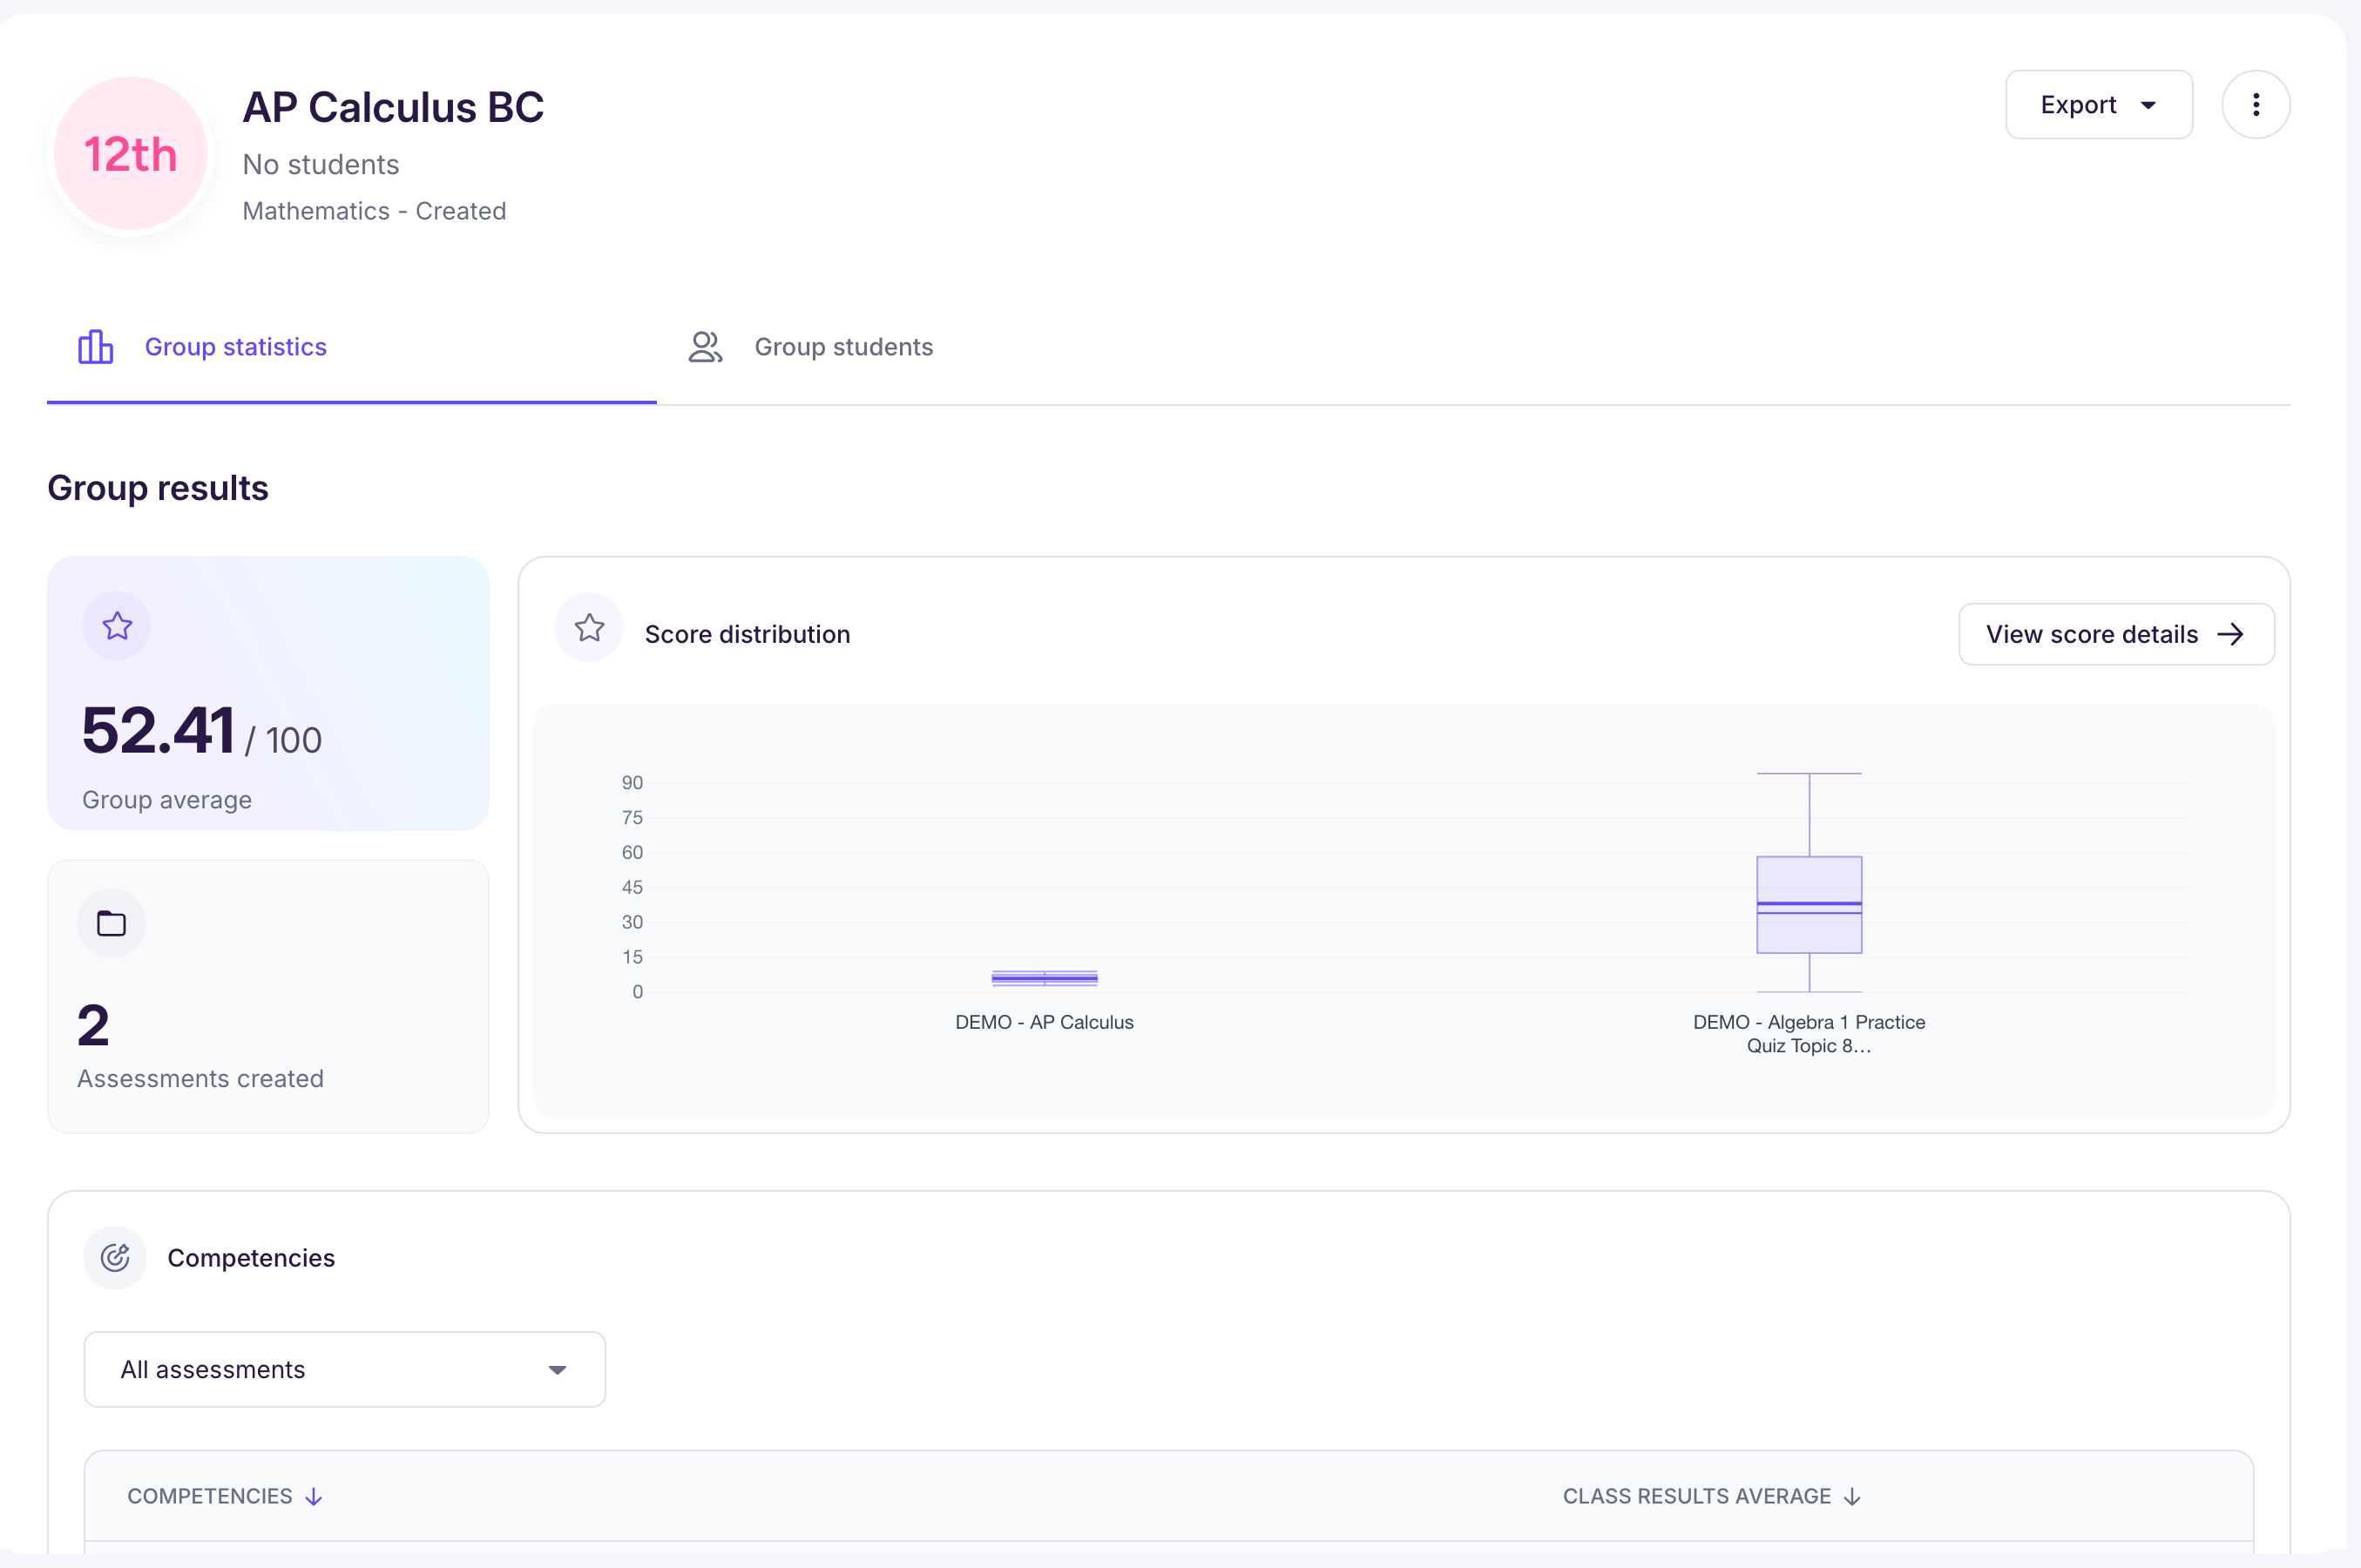
You can see all the results of several assessments in “My Groups”: click a group to see its “Group results”.
This summary lets you see your students’ results for a given group across several assessments, spot the skills they’ve mastered or not, and identify the most frequent errors over a given period.
🔢 What data is available?
🎯 Group average
Shown at the top left of the page, the “Group average” is the average of the results across all the assessments this group took. The number of assessments is shown below it.
This average gives you a first read on the overall level of your students on these assessments.
📈 Score distribution
If you grade with scores, you get:
-
Distribution chart: box plots of the group’s results on each assessment.
-
The horizontal line inside the box is the median (the middle score).
-
The box runs from the first to the third quartile: it holds the 25% of scores just below the median and the 25% just above it.
-
The whiskers reach the extreme values (the lowest and highest score).
-
All assessments show by default, and you can choose which ones the chart includes.
-
-
Detailed table by assessment: each student’s results on every assessment, with the average, lowest and highest score.
➡️ You can export the table to Excel (“View score details”, then “Export Results”), which is handy for a PLC meeting.
📈 Competencies
If you grade with competencies, a “Competencies” section appears on your group’s analysis page.
-
It shows your group’s mastery level on every competency assessed across assessments. You can choose which assessments the summary includes.
-
Click a competency to see its mastery level assessment by assessment.
🧠 Our analysis
In this section, you find Ed.ai’s own analysis, compiled for the group:
-
A detailed analysis of the skills assessed across the group’s assessments. You can choose which assessments it includes. For each skill, you see:
-
the distribution of mastery levels (“Below Expectations”, “Emerging”, “Satisfactory”, “Excellent”), with the number of students at each level
-
a clear view of the class’s strengths and areas for improvement
-
-
A detailed analysis of the errors found in papers across the group’s assessments, through the “Skills” / “Observations” toggle
-
Errors are grouped into categories for your subject: see Comprendre le suivi des erreurs en mathématiques
-
For each type of error, you see the “Number of occurrences” and the “Students involved”
-
🧩 What’s next?
Analysis connects to reteaching, which lets you generate personalized activities based on the skills students haven’t mastered yet.